Trace
Trace is a performance analysis tool. With Trace, you can obtain a detailed rendering workflow of Lynx pages, making it easier to locate, analyze, and fix issues such as jank and long-running tasks.
Core Capabilities of Trace
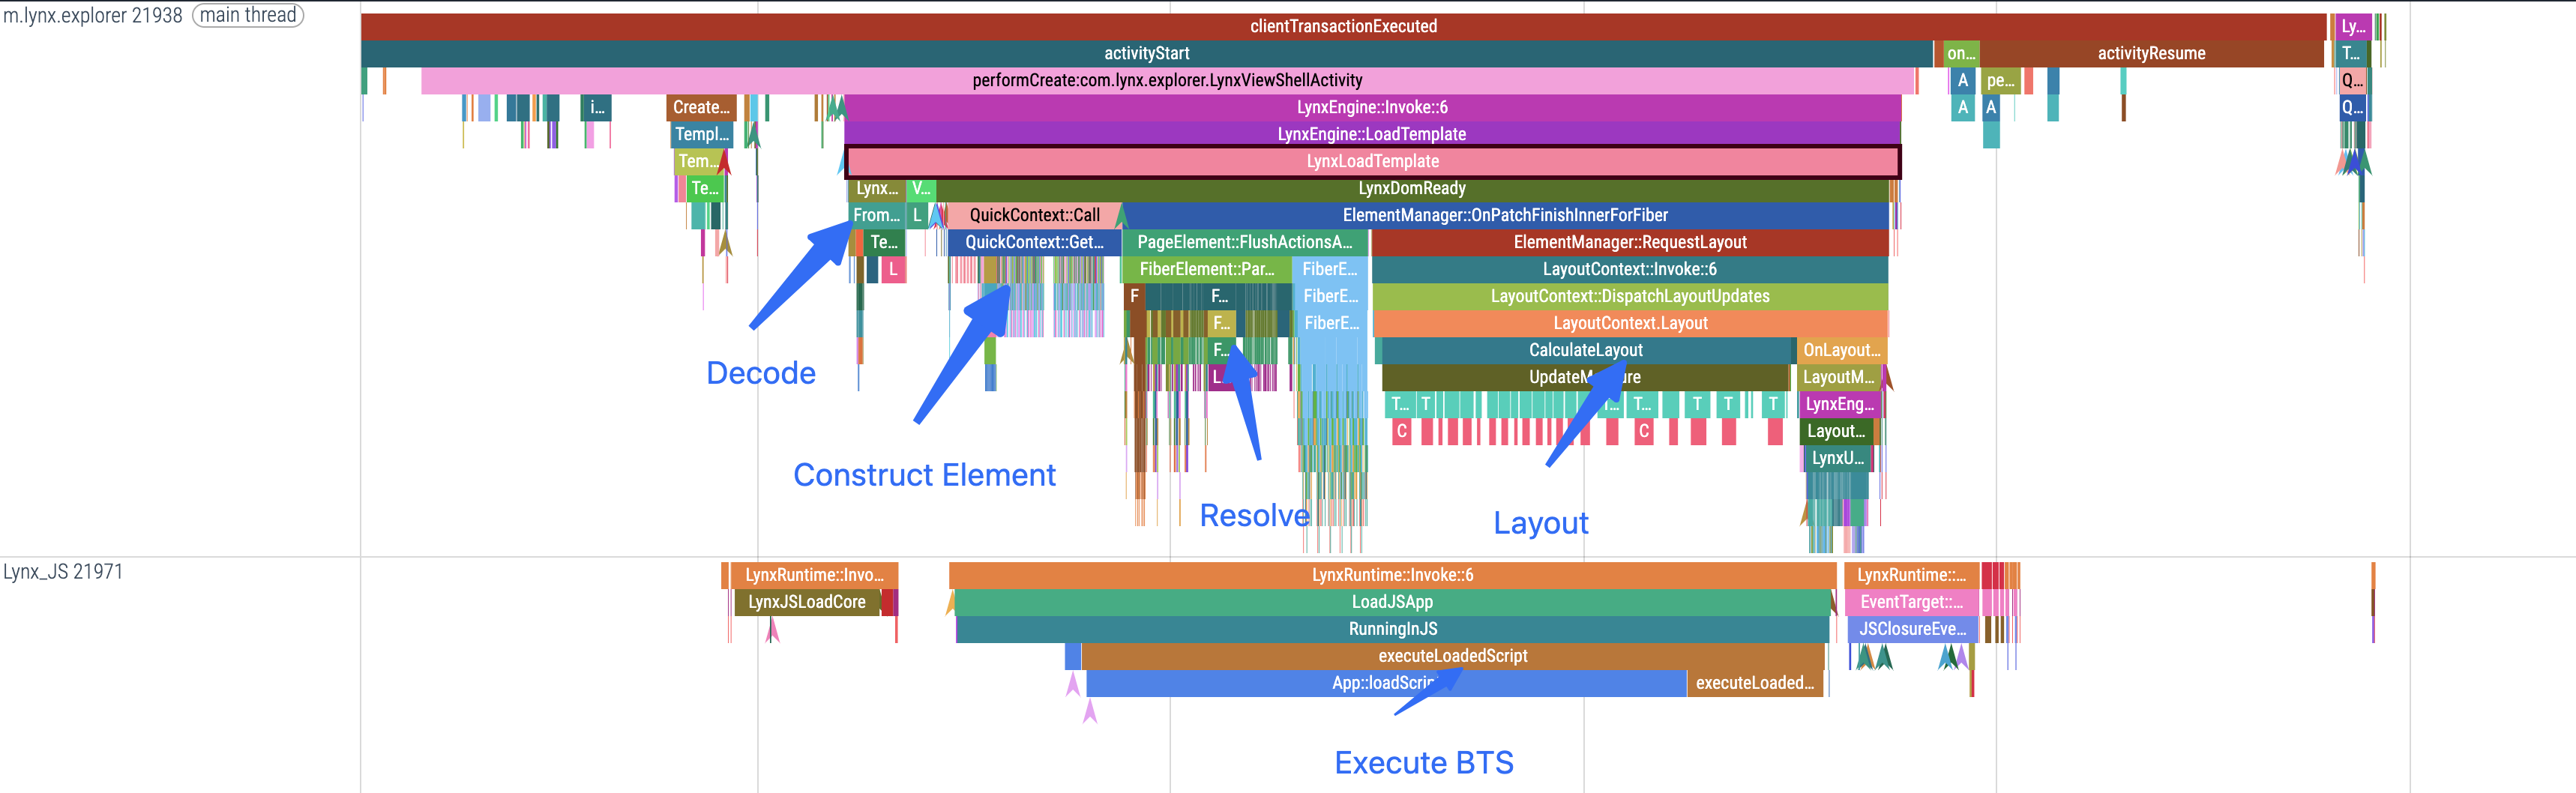
1. Visualizing the Rendering Pipeline
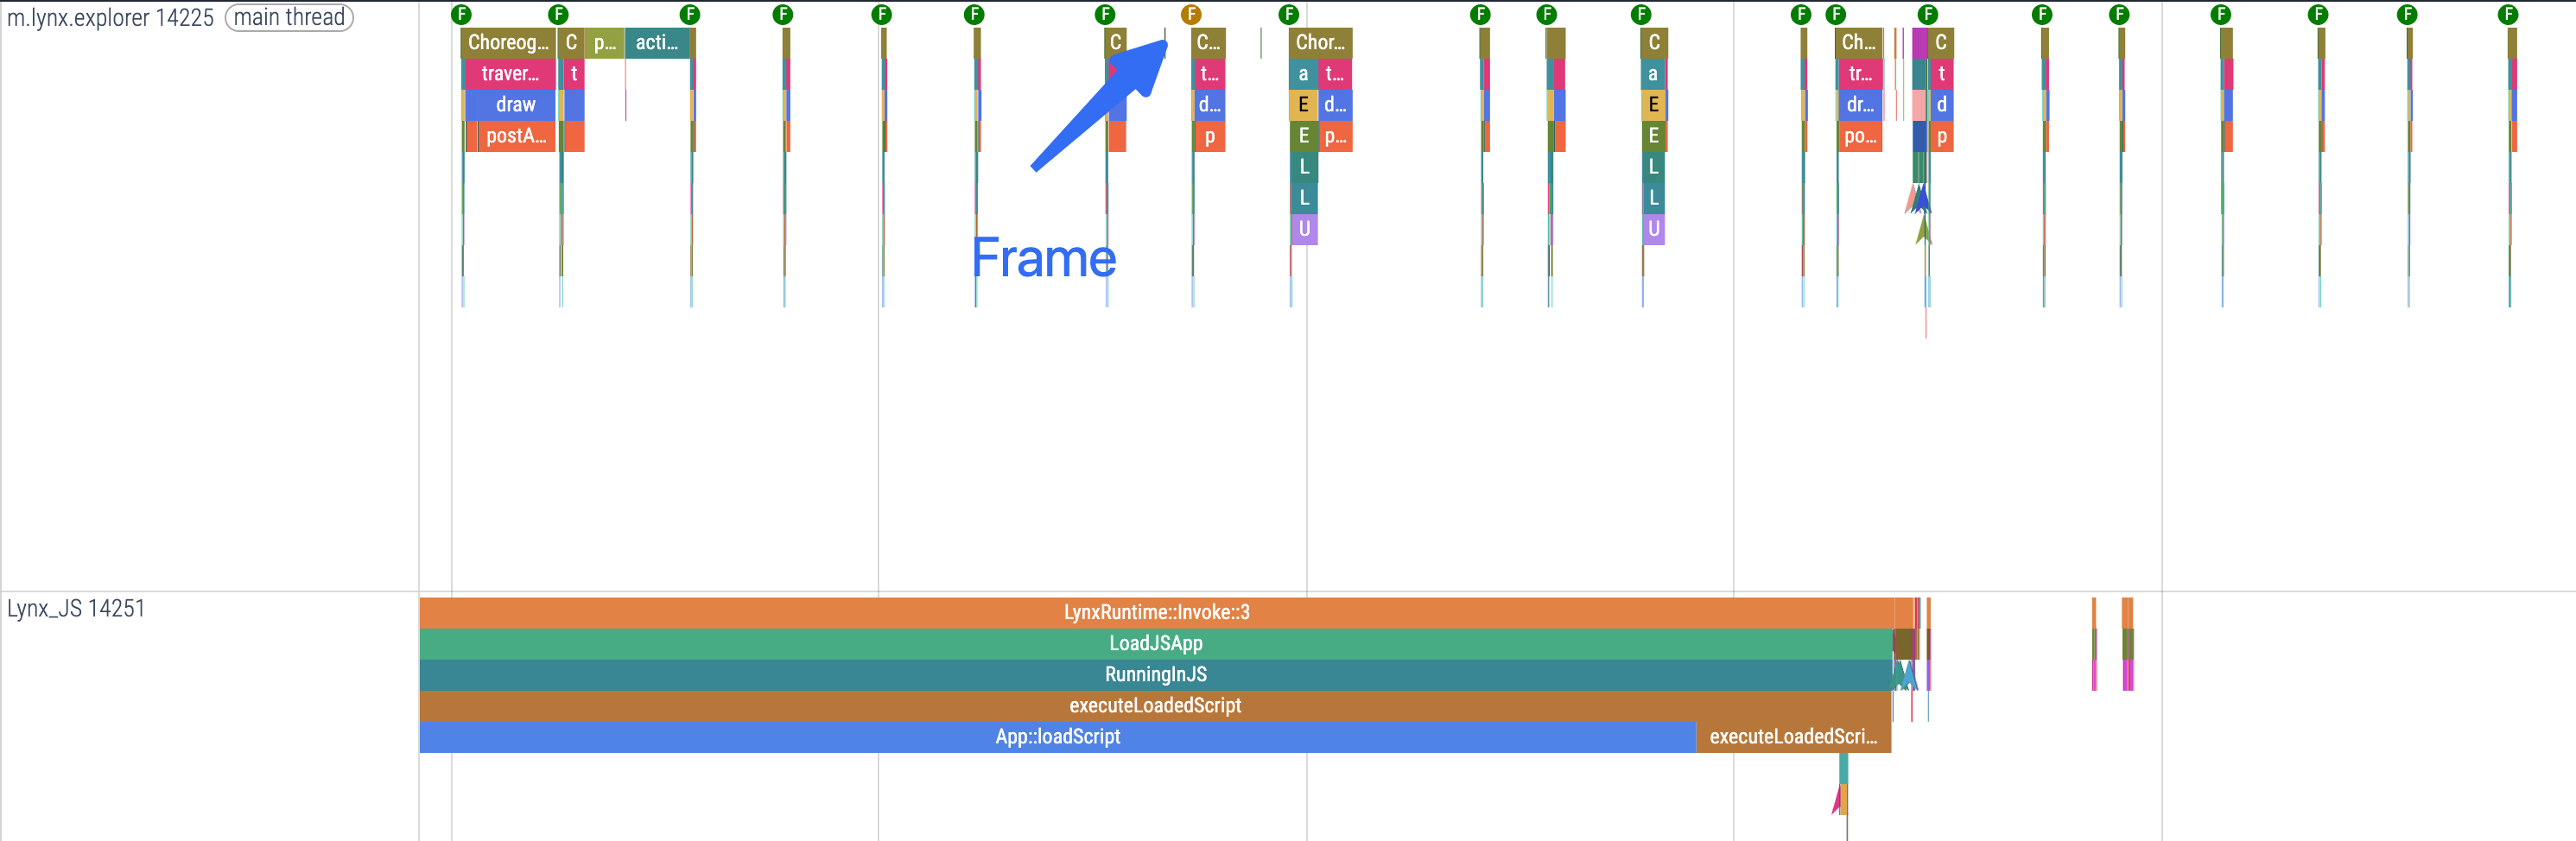
Trace provides a complete timeline view of the entire page process, detailing each stage: script execution, element construction, layout calculation, final rendering and others. With Trace, you can:
- Clearly see the time distribution for each key stage (such as layout and painting);
- Directly identify bottleneck nodes and performance issues;
- Detect redundant or repeated rendering tasks to optimize page performance.
This end-to-end visualization is especially valuable for page optimization and tuning complex page performance.
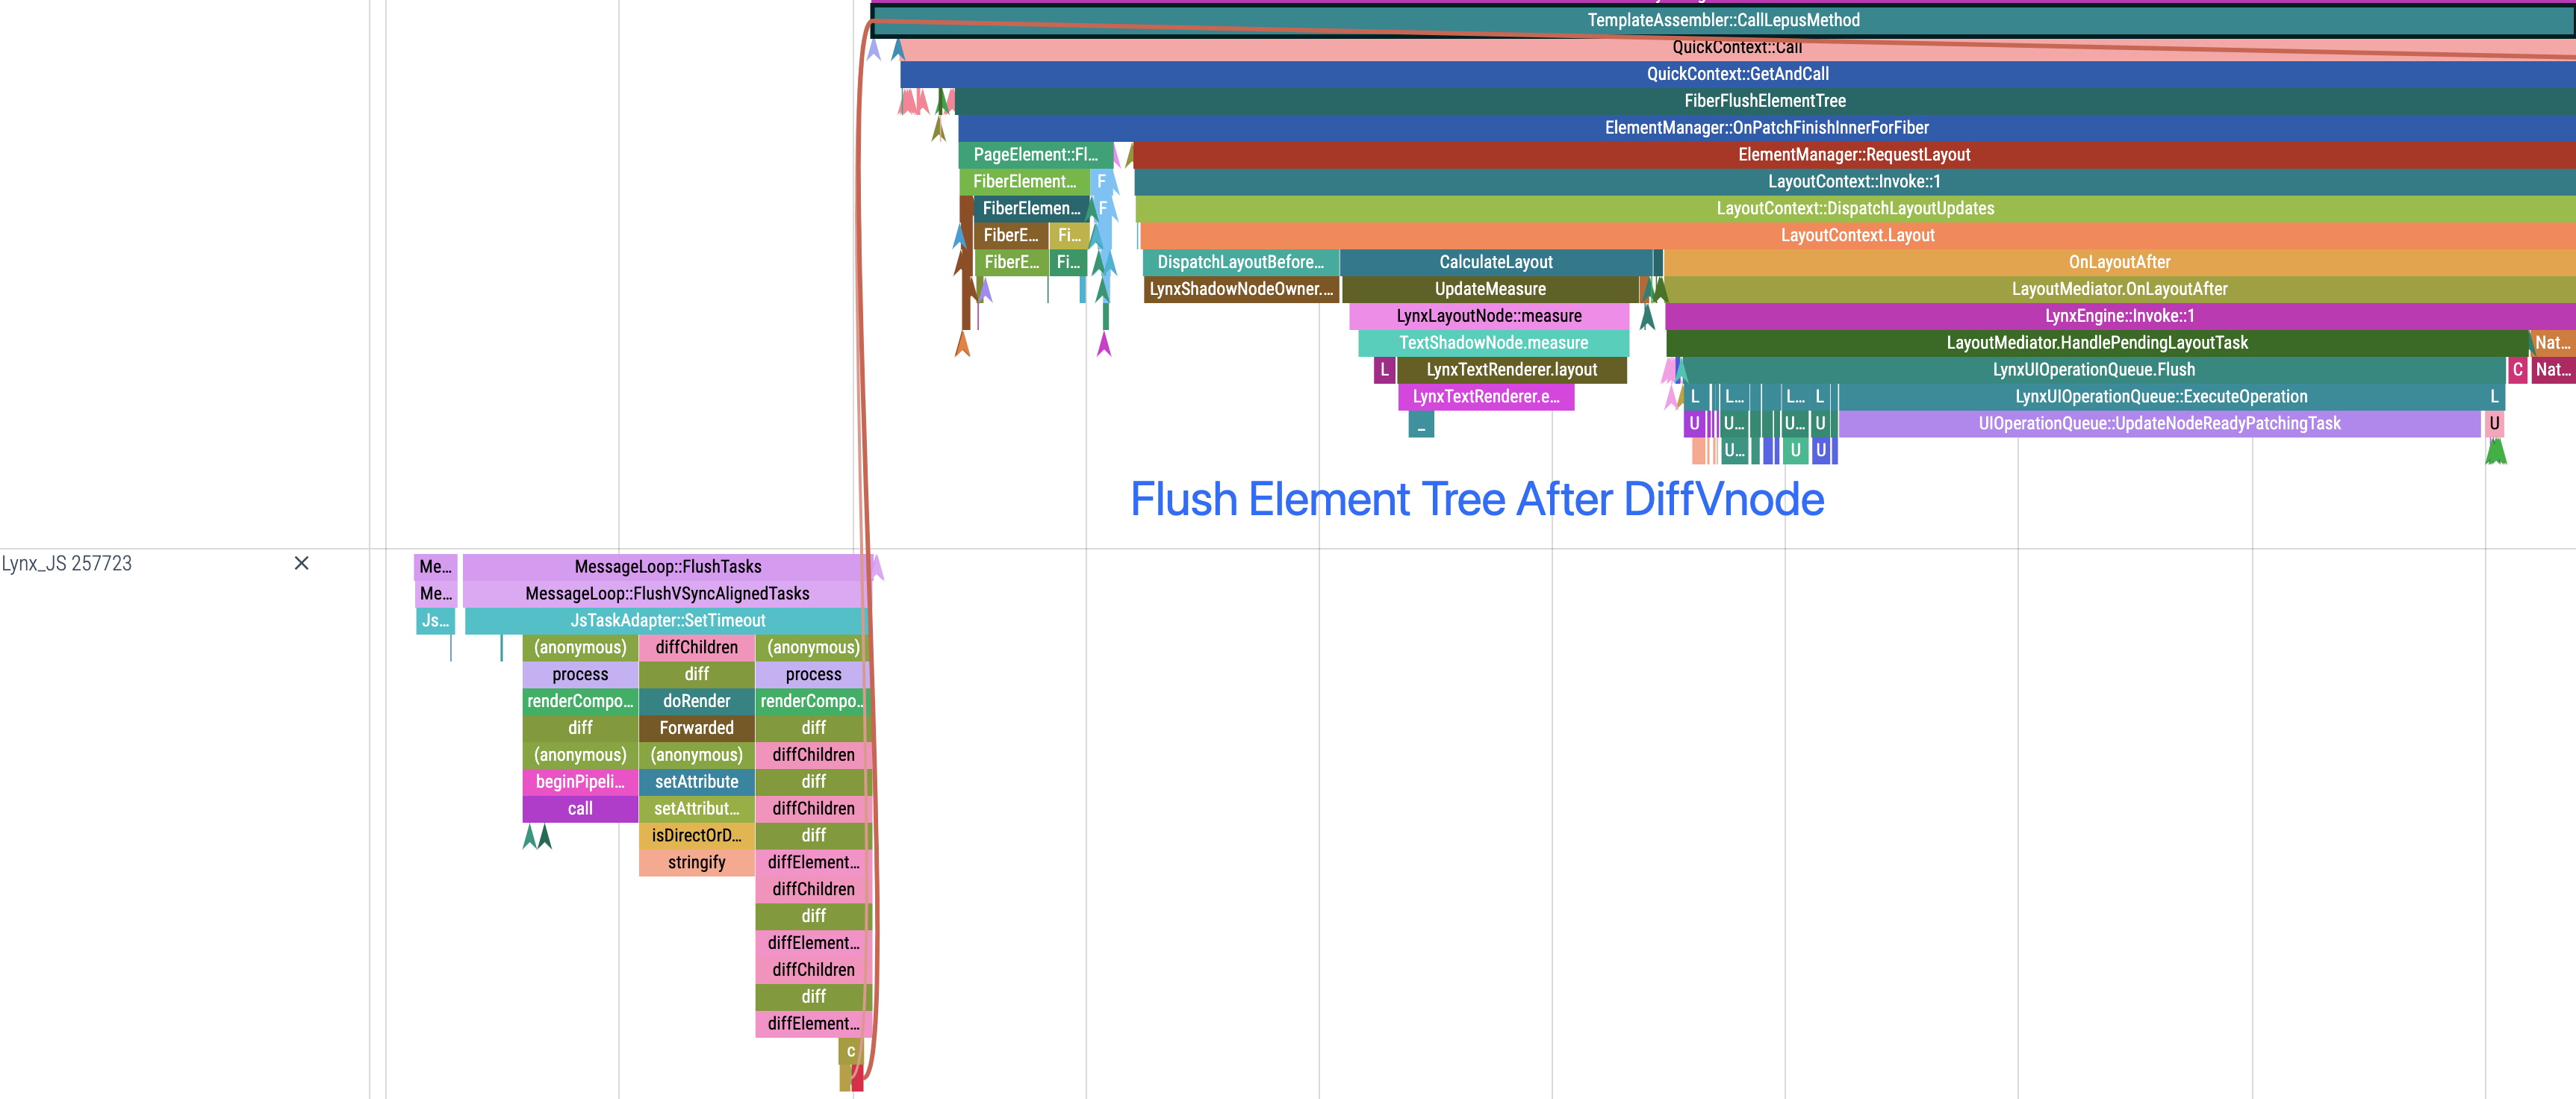
2. Tracing Engine Execution
Trace dives deep into the Engine and thoroughly records:
- The sequence of task scheduling and queue switching
- The full picture of event handling chains
- Precise timing and relationships for API calls
This information is useful for analyzing issues like asynchronous task congestion or event response delays.
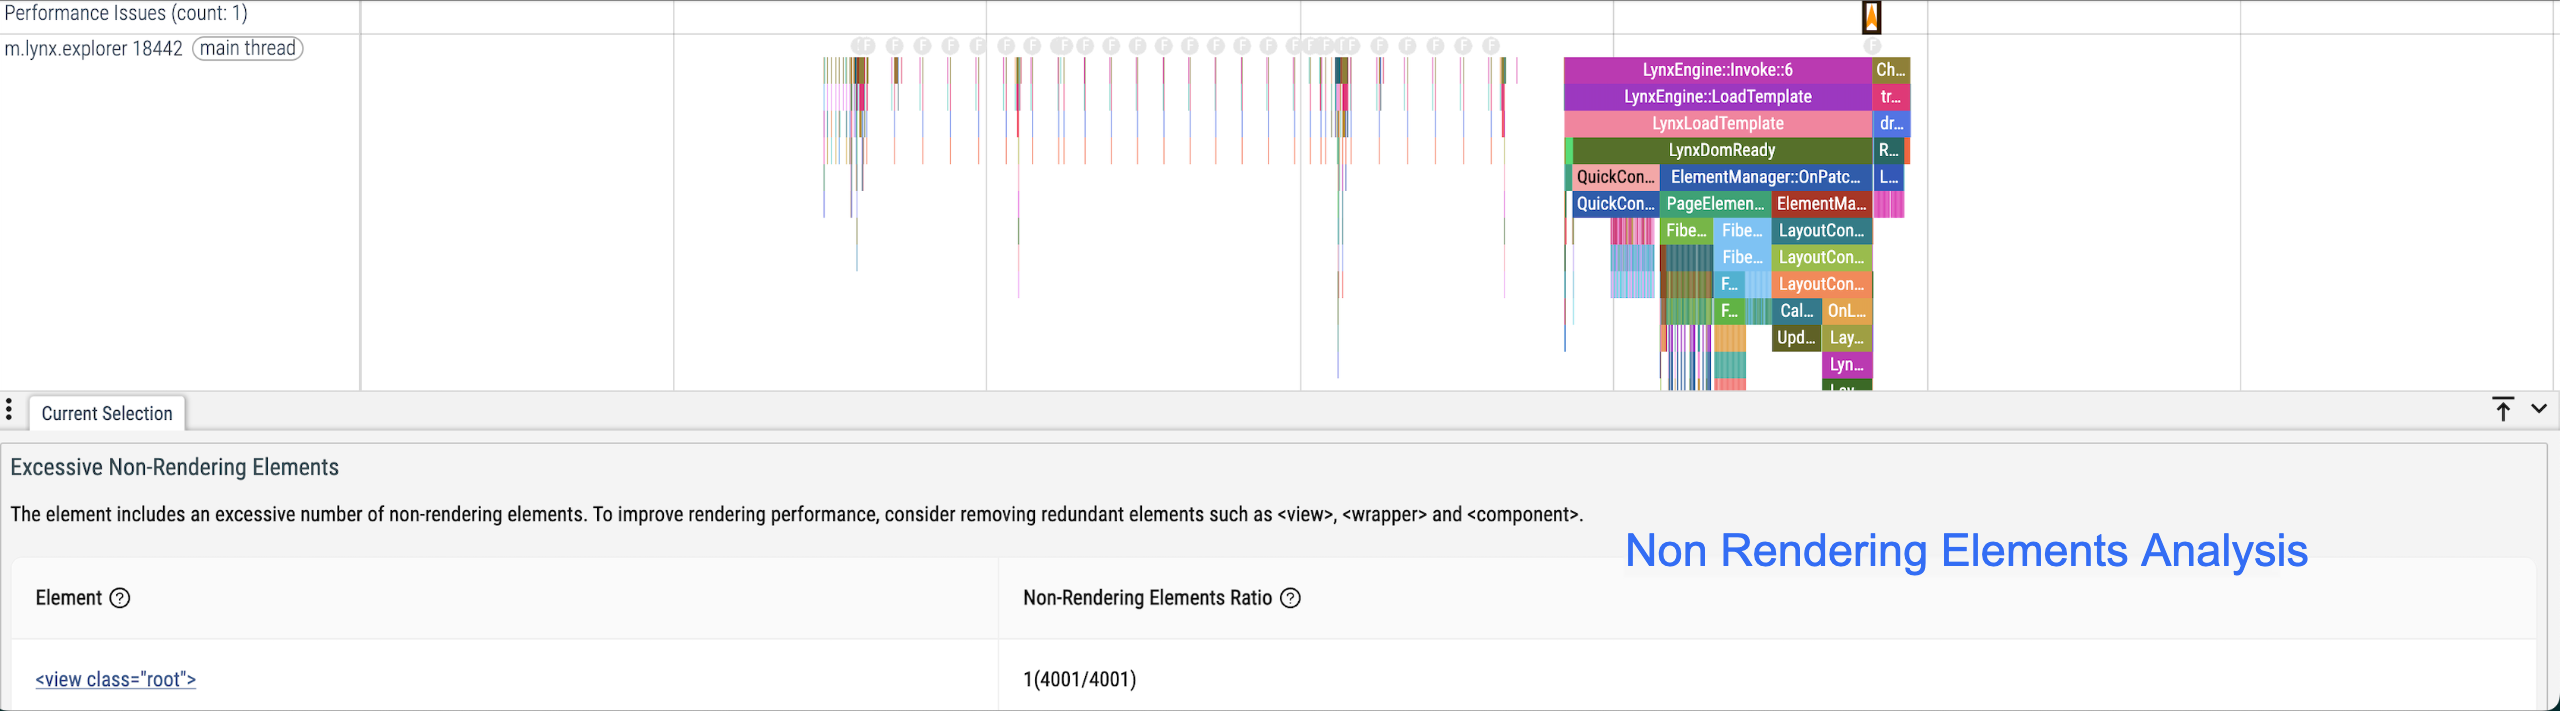
3. Rich Performance Analysis Tools
Trace is a multidimensional performance analysis platform:
- Element Analysis: Track changes in the Element tree structure, identify high-frequency or heavy node operations, and uncover performance risks in your page structure.
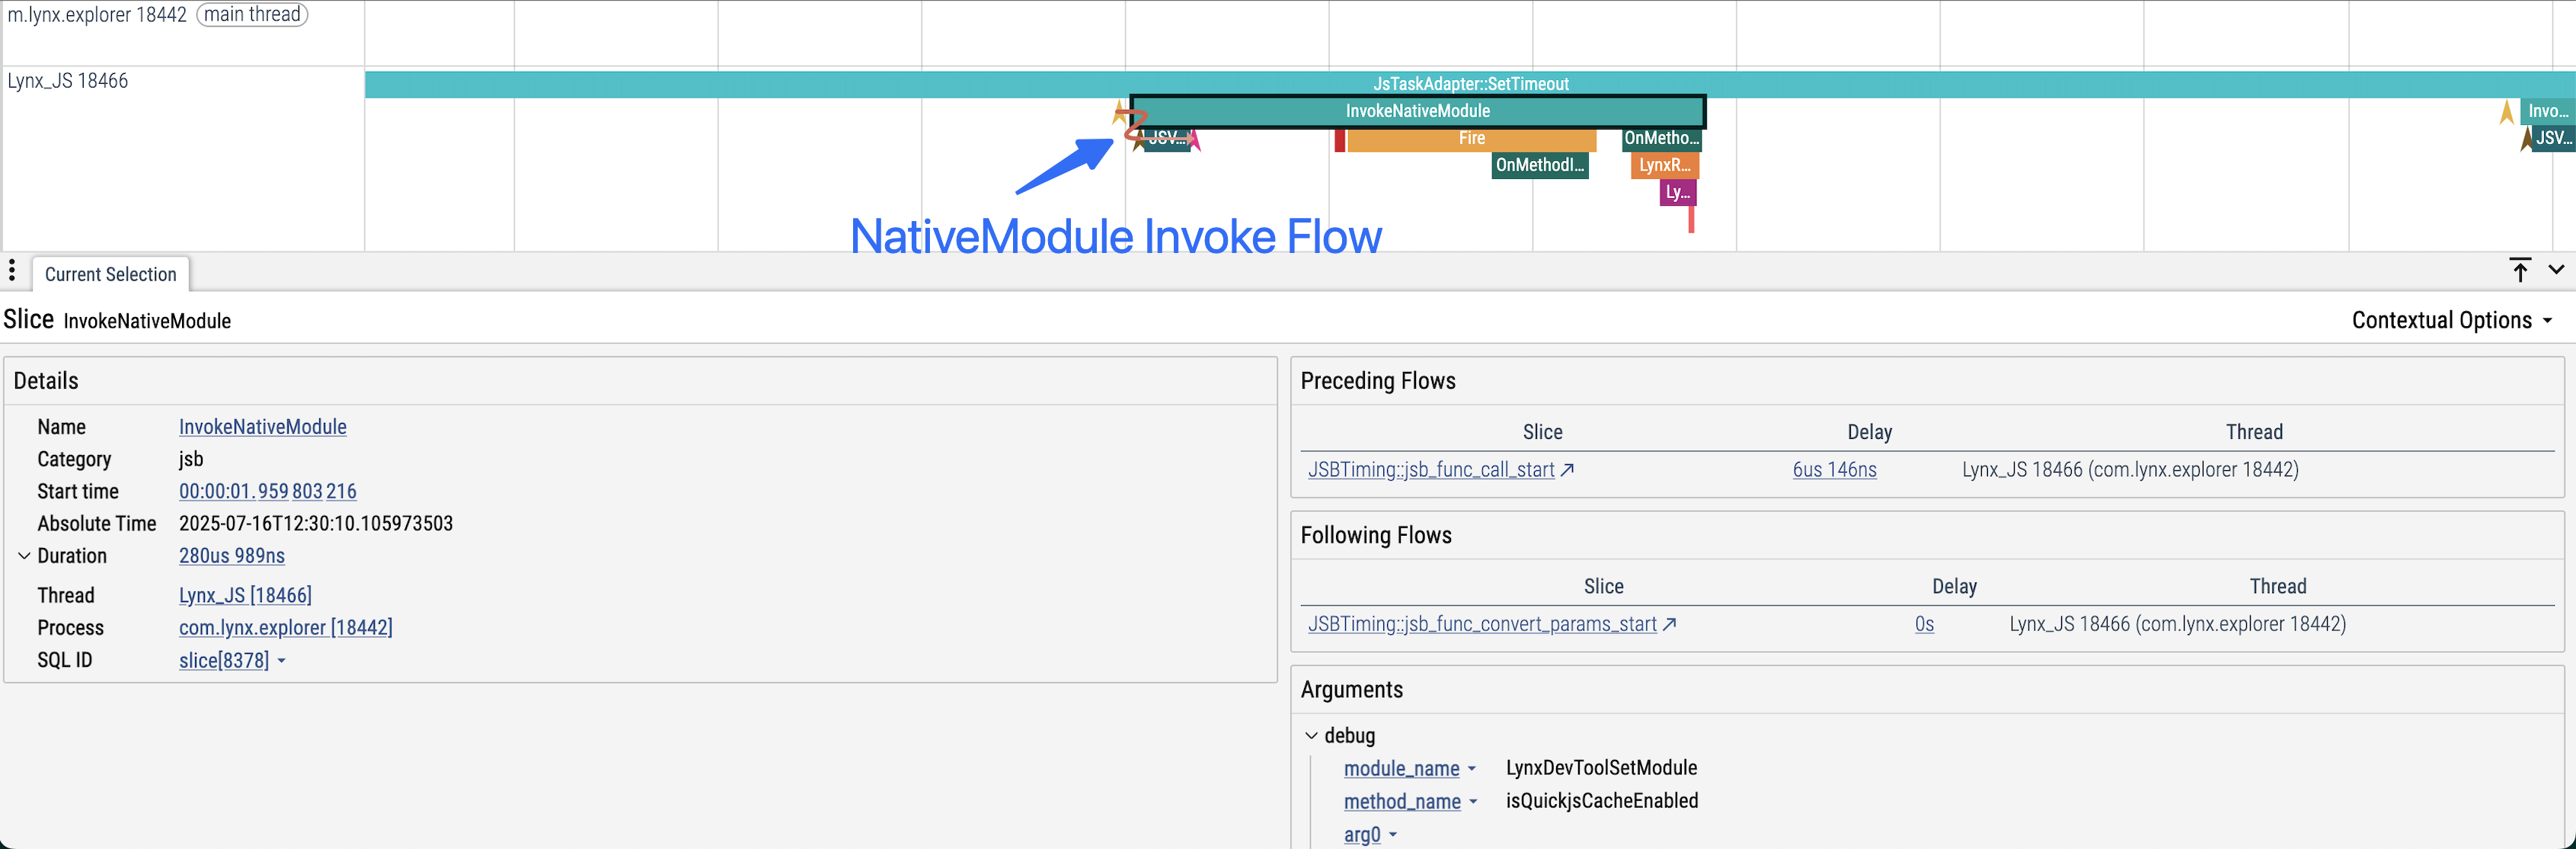
- NativeModules Call Analysis: Monitor detailed NativeModules call processes, clearly display the timing and parameters of each NativeModule call, and pinpoint potential bottlenecks.
- Smoothness Analysis: Use flame charts of task durations to quickly locate the root causes of jank, helping you optimize animations and interactions.
Next Steps
Compatibility
LCD tables only load in the browser