
Runtime Profiling
Profiling Lynx
Following the instruction of Record Trace to profiling Lynx.
Profiling Framework
You can analyze framework performance in two ways: via build configuration and using the JS Profile.
Enabling via Build Configuration
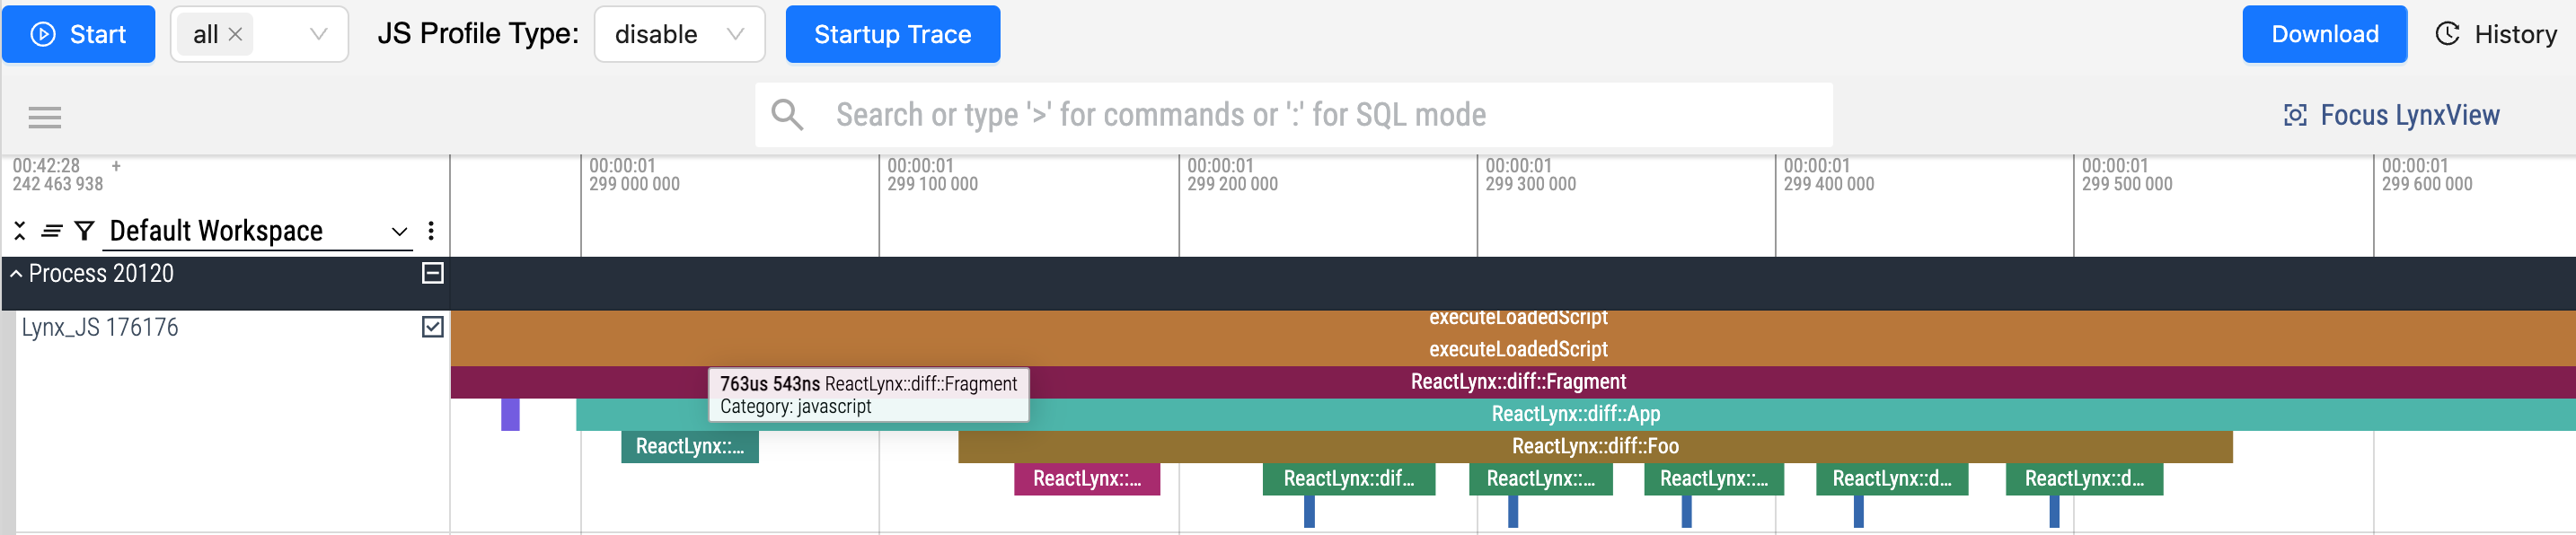
We provide the builtin trace points in frameworks like ReactLynx (Components' render and diff).
- In development(
rspeedy dev): ReactLynx-related trace points are added by default. - In production(
rspeedy build): ReactLynx-related trace points are removed by default.
These tracing points show how components are rendered and diffed.
Run profiling in production
The trace points can be enabled by setting the performance.profile to true when build.
You may use rspeedy preview to preview the output locally.
This is useful when trying to optimize the performance of the application.
Do NOT deploy the output with performance.profile: true. They are not for production.
Disable profiling in development
The trace points can be disabled by setting the performance.profile to false when dev.
Dynamic Sampling with JS Profile
Use the JS Profile tool to collect call stack data at runtime without modifying the build configuration.